Expenses
Ontario Tech has historically implemented a hybrid or two-step approach to budget modelling. In the first step, an incremental budgeting approach is used to address mandated year-over-year increases in known expenses (e.g. contractual salary increases, licensing agreements). Simply put, these increases are automatically factored into the preceding year’s base budget on an annual basis and updated. In the second step, a strategic incentive allocation mechanism is used to distribute discretionary resources (when available) to support new initiatives that align with the priorities of our Integrated Academic-Research Plan (IARP).
Activity-based budgeting (ABB) model
Over the past decade, Ontario Tech has used an activity-based budgeting (ABB) model in the background to simply inform strategic budget allocations. This is a method of budgeting where revenues and expenses are attributed to the areas that generate them. When fully implemented to inform budget allocations, this approach deliberately sets aside funds through revenue-based levies, thus creating a dedicated resource pool to fund strategic priorities and to construct clear incentives for faculties and departments to generate revenue and manage their expenses more consciously.
To create greater transparency, budget understanding and incentives to support differentiated growth during the 2023-2024 fiscal year, the Budget Working Group in collaboration with senior leadership and the deans began to move intentionally toward implementing an ABB model. This model will be shared in the forthcoming budget-setting paper.
The implementation of an ABB model has been necessitated by the fiscal challenges created by the current provincial government’s policies (e.g. frozen domestic tuition fees, no additional funding for domestic growth). Simply put, this means that 68 per cent of our total revenues (i.e. 29 per cent regulated tuition and 39 per cent grant revenue) are frozen and subject to no annual increases.
Budget dynamics and enrolment growth requirement
As stated earlier, without further enrolment growth, our revenues are growing at the rate of about 1 per cent on an annual basis. In contrast, using very conservative expense assumptions, our expenses are growing at an average annual rate of 3.6 per cent. This includes a 5 per cent increase attributable to annual mandated salary increases, which encompass across-the-board adjustments and annual progression factors (e.g. promotion increments).
Reallocation of existing budget dollars
To limit the growth in expenses, academic and administrative units are being asked to cover inflationary and contract increases through the reallocation of existing budget dollars. Stated another way, the university is faced with a budget that is contingent upon continuous enrolment growth to fund base operating expenses (Figure 3). To provide some context, salary increases are expected to grow above $6.5 million in each of the next few years. Given that grant and tuition revenues remain stagnant for the foreseeable future, we must enrol about 500 additional students annually to merely cover the mandated salary costs.
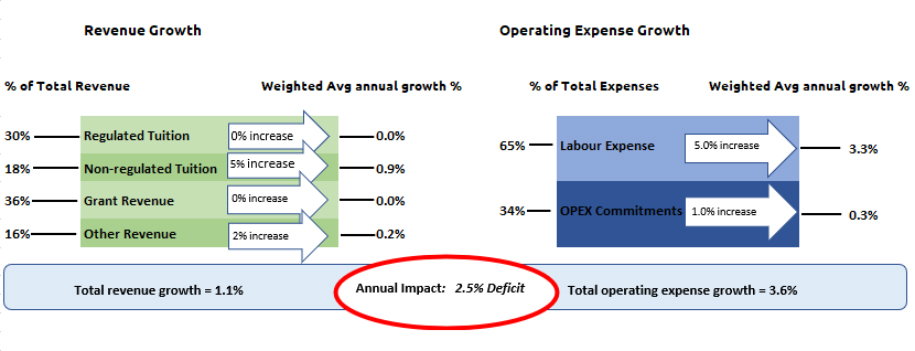
With a total revenue growth of 1.1% and total operating expense growth of 3.6%, the annual impact is a 2.5% deficit.
For an accessible version of this figure, please contact budget@ontariotechu.ca.
Factors that influence operating expenses
Operating expenses are influenced by several factors including, but not limited to, inflation, the rising costs of key goods and services (e.g. software licenses, library subscriptions), and the cost of maintaining and servicing aging facilities. Prior to the pandemic, the Ontario university system typically saw an annual increase in expenses of about 4 per cent. However, between 2021 and 2023, many of these essential expenditures skyrocketed, reaching double-digit percentages. Utility costs and software licensing fees, moreover, continue to increase at these rates. Given that these and other expenses continue to rise, restraining operational expense growth will be required and units may need to reallocate funds from their existing budgets to cover these costs. This will require each and every unit on campus, in alignment with the IARP, to determine if there are activities that must be continued versus others that must be discontinued.
In 2023-2024, our expenses were higher than our revenues as a result of spending commitments and project expenses from prior years. This required reserves to be used to cover the difference. Understanding this context is important as we look forward to the 2024-2025 budget where, compared to the previous year, there is a projected $8.9 million increase in overall expenses (i.e. $236 million compared to $227 million).
- Personnel costs
- Financial aid costs
- Facilities costs
- Information Technology (IT) costs: Major enterprise Initiatives
Additional resources must be allocated to expand our faculty and staff capacity to support new and existing programs, to enhance our ability to move toward the highest quality of hybrid learning capabilities, enhance co-operative education opportunities, and to strengthen supports for teaching and learning, technology and our student recruitment efforts.
Just under 70 per cent of our annual budget supports personnel costs, including salaries and benefits. This is higher than the median for the Ontario university system, which is at 62 per cent. The 2024-2025 base budget already includes almost $10.3 million more in expenses to cover employee labour costs compared to last year’s budget. It is important to note that this year’s cost is considerably higher in comparison to past years due to the One-Time Retirement Incentive Program for Tenured, Tenure-Track and Teaching Faculty Members as outlined in the recent UOITFA Collective Agreement.
In 2011, our Senior Academic Team set a goal to improve the student-to-faculty ratio from 36:1 to 31:1, aiming to enhance the educational experience of our students and move closer to the provincial average. Our current faculty complement would keep us in this range (Figure 4).
| FTE COUNT - TOTAL | 2022-23 Actual | 2023-24 Budget | 2024-25 Budget | 2025-26 Forecast | 2026-27 Forecast |
|---|---|---|---|---|---|
| FFTE's | 9,485 | 9,491 | 10,466 | 11,071 | 11,379 |
| Faculty | 339.0 | 336.3 | 338.9 | 357.1 | 367.1 |
| Staff | 554.5 | 584.2 | 588.2 | 603.2 | 616.2 |
| Total FTE | 893.5 | 920.5 | 927.1 | 960.4 | 983.3 |
| Student:Faculty | 28.0 | 28.2 | 30.9 | 31.0 | 31.0 |
| Student:Staff | 17.1 | 16.2 | 17.8 | 18.4 | 18.5 |
Five per cent of our annual budget expense is allocated for scholarships, bursaries and fellowships to help students attend our university and to support our institutional access agenda. In line with our international student growth targets, we have introduced programs to allocate funds to assist our international students. In 2023-2024 alone, with increasing investments in entrance scholarships, graduate student assistance, and a new international support program, we will distribute more than $11 million to our students.
Ten per cent of our budgetary expenses include the costs associated with the annual physical infrastructure maintenance. This includes more than $5 million annually in building leases and $3 million for the unfunded portion of the debenture.
The following three main items require further consideration when setting our 2024-2027 budget cycle:
- Nondiscretionary costs, such as utilities, are experiencing annual increases of more than 10 per cent, translating to an additional $250,000 cost for the 2024-2025 budget year.
- Our commitment to achieve net zero by 2050 entails some major projects in the coming years.
- We require surpluses to fund future capital requirements. In November 2021, the Audit and Finance Committee was presented a Strategic Reserves Discussion Paper, which aimed to assess and prepare for future capital maintenance and replacement needs. While more than 60 per cent of our buildings are in excellent condition, funds need to be set aside for future renovations. There is a need for above $4 million annually for the next decade to deliver on planned activities such as routine repairs (e.g. roof replacements) and future buildings.
To ensure the continued effectiveness of our IT enterprise system, we have planned major initiatives over the next four years:
- Currently, Ontario Tech and Durham College share the same enterprise (i.e. Banner) system. Each institution’s data are maintained separately using Shared Technology Platforms (STPs). The STPs have proven effective in facilitating synchronized progress of enterprise systems while preserving a measure of operational autonomy. Although STPs are effectively used by some universities in the United States, we have found that our university’s distinct computing needs are testing its limits. As a result, Ontario Tech and Durham College must consider moving to separate enterprise systems. This is a significant endeavor as it would involve more than just separating into two systems such as:
- Purchasing and implementing other peripheral systems that are currently shared.
- Re-architecting how we deal with people on the same campus using many shared IT services, but in separate Banner systems.
- The redesign of how jointly offered academic programs are captured in Banner.
- Currently, Banner operates on-premises, but we are exploring the benefits and implications of moving to the cloud. Several cloud models are being considered, including Platform as a Service (PaaS) and Software as a Service (SaaS). Both PaaS and SaaS offer their own advantages, disadvantages and costs. A move to the cloud could provide more agility in the enterprise space for Ontario Tech, but it is nonetheless important to select the right model and timing for the transition. SaaS, for example, is an effective cloud model, but not all of our required enterprise system functionalities are available at this time. A move to the cloud involves not only the system’s migration but also potential changes in the interaction with peripheral systems, data migration, security adjustments, and user and technical staff retraining, etc.
The initiatives highlighted above are significant undertakings in our IT enterprise environment. If Ontario Tech and Durham College move ahead with these initiatives, we estimate the total additional cost for the university to be $10 million over four years.