Insights on Climate Change Study
Posted by Mehdi Hosseini on June 17, 2014
Cities consume most of the world’s energy, so they release the greatest amount of global carbon emissions. They are also the primary contributor to a country’s economy, which leads to technology development and changes in lifestyle.
Researchers at the University of Toronto and the University of Ontario Institute of Technology (UOIT) have made a sustained effort within the past five years to collect data on the greenhouse gas emissions (GHG) of 22 of the world’s largest cities, which is believed to be important if strategic plans towards reducing carbon emission are to be created.
In the study by C. A. Kennedy, N. Ibrahim, and D. Hoornweg, GHG emissions data from transportation, buildings, electricity generation, industry, marine and aviation were collected, and a wide variety of specific strategies are suggested to reduce emissions. The level of a city’s GHG emissions is compared against its gross domestic product (GDP), which shows a general increase of emission level with the increase in GDP for the 22 cities studied by Kennedy et al. The figure below shows how cities with different GDPs have different levels of carbon emission.
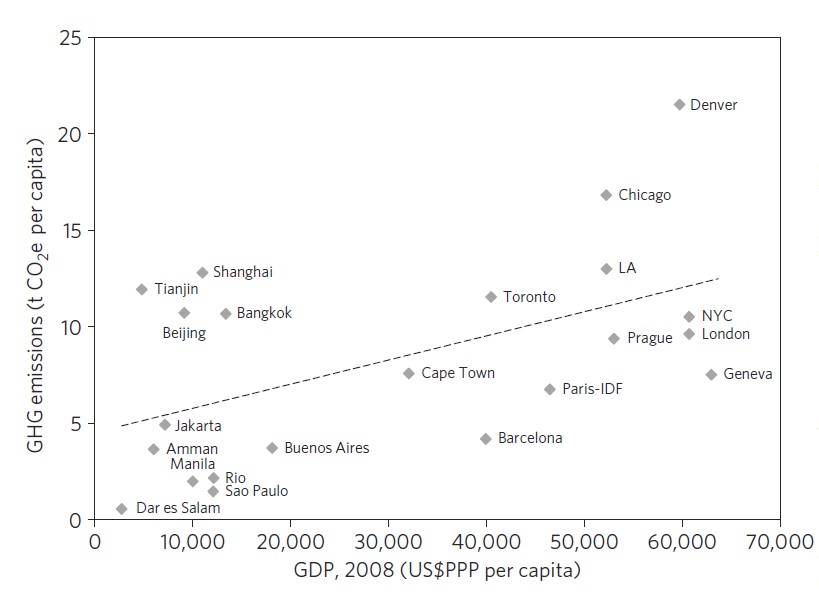
Among the five North American cities (Denver, Chicago, LA, NYC, and Toronto), only New York City has a GHG emissions level below 10 tCO2e per capita. These cities, as shown in the figure, have higher GDP per capita compared to Chinese or South American cities.
What is interesting to me is that Toronto – a well-developed, low-density city – has an emission level much greater than the world’s average. With 11 tCO2e per capita and a GDP of nearly $40,000 per capita, Toronto is aiming at decreasing its emission levels from 1990 by 30 per cent before 2020. These targets were set as part of the Climate Change and Clean Air Action Plan, passed by the Toronto City Council in 2007. A major element in the overall reduction strategy was in the electricity generation sector due to the ongoing coal phase-out. Efforts in other sectors, including waste management, natural gas purification, and energy conservation, has helped with the considerable achievements in decreasing carbon emissions in Toronto. Despite all these effort, however, transportation and congestion remains a challenge for the City of Toronto.
The authors of the paper also distinguished the cities according to their per capita electricity consumption (which is usually related to the economic development) and in doing so, the number of heating days and the population densities are taken into consideration. The full paper can be reached at: www.nature.com.
Filed under: Sustainability 101