Sustainability cost curves
Climate change, biodiversity loss and nitrogen cycles in the world's largest cities are already believed to be beyond sustainable boundaries1. As these cities continue to grow in both size and population, our planetary limits will be severely threatened. In a study currently underway at UOIT, researchers are examining the need to adhere to planetary physical limits and reduce environmental degradation through socio-economic targets.
The marginal abatement cost (MAC) curve presented in Figure 1 demonstrates a set of available options for a long-term and comprehensive program which addresses emissions reduction opportunities across several sectors, including power, industry, waste, buildings, transport, agriculture and forestry.
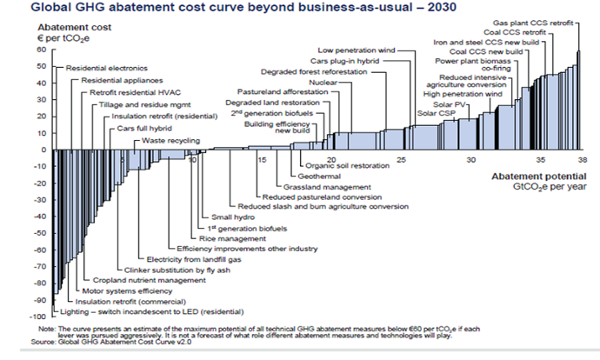
Figure 1: Marginal Abatement Cost Curve - Global Greenhouse Gas Emission Reduction2
The researchers conducting this study have created sustainability cost curves for energy, transportation and connectivity, as well as basic service provision (water and sanitation) and present model cost curves for the transportation sectors of five of the world’s largest cities: Toronto, Sao Paulo, Shanghai, Mumbai and Dakar.[1] Johan Rockstrom, Will Steffen, Kevin Noone, Asa Persson, F. Stuart Chapin, Eric F. Lambin, Timothy M. Lenton, Marten Scheffer, Carl Folke, Hans Joachim Schellnhuber, Bjorn Nykvist, Cynthia A. de Wit, Terry Hughes, Sander van der Leeuw, Henning Rodhe, Sverker Sorlin, Peter K. Snyder, Robert Costanza, Uno Svedin, Malin Falkenmark, Louise Karlberg, Robert W. Corell, Victoria J. Fabry, James Hansen, Brian Walker, Diana Liverman, Katherine Richardson, Paul Crutzen, and Jonathan A. Foley, 2009, "A Safe Operating Space for Humanity," Nature, 461, pp. 472-475.
[2] McKinsey & Company, 2010, Impact of the Financial Crisis on Carbon Economics, http://www.mckinsey.com/client_service/sustainability/latest_thinking/greenhouse_gas_abatement_cost_curves.
Please note this is a draft version. For development purposes only.