Shanghai
Sustainability Cost Curves: Applying the Methodology to Transportation in Shanghai
Figure 1 demonstrates the sustainability cost curve for Shanghai's subway extension lines 11, 8, 10 and 2 transportation projects.
For each project, the physical and social science indicators are evaluated against estimates for the costs and financial benefits of the project. The net cost of each activity (from published data) and the total sustainability factor obtained from the physical and socio-economic indicators are plotted. The activities are plotted relative to each other to yield a sustainability cost curve.
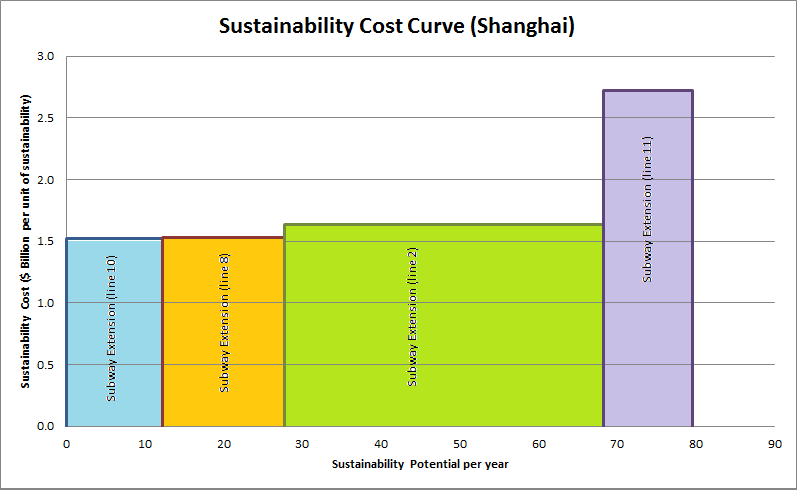
Figure 1: Sustainability Cost Curve (Transportation - Shanghai)
Please note this is a draft version. For development purposes only.