Toronto
The Greater Toronto Area (GTA) follows common traits of most affluent cities with a disproportionate contribution to climate change, nitrogen cycle, change in land use and fresh water consumption, as highlighted in Figure 1 and Table 1. Of the 44,838 species assessed in the IUCN ‘Red List’ [1], 16,928 are listed as threatened, of which 180 are local to Ontario, Canada, according to the Ministry of Natural Resources and Forestry [2]. Canada’s ecological footprint is used to estimate biodiversity loss in Toronto, as these numbers are reported at country scale in the WWF’s 2014 Living Planet Report [3]. Values are expected to be further refined with additional consideration for activities such as migratory bird loss in Toronto (caused by birds striking high-rise buildings at night).
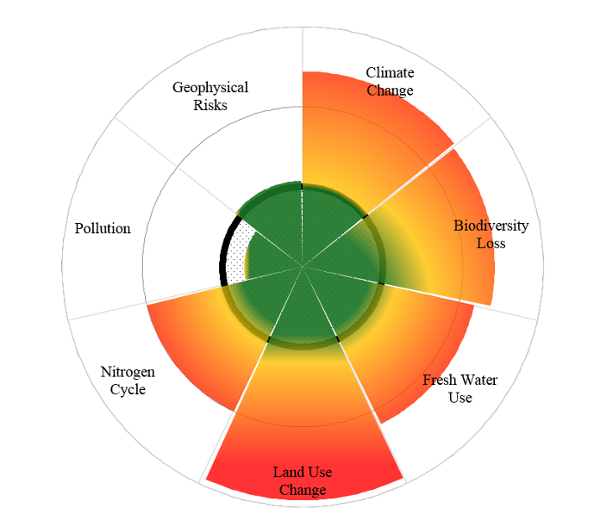
Figure 1: Physical Science: Toronto vs. Global Condition
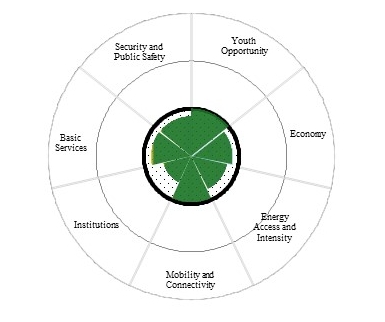
Figure 2 and Table 2 highlight Toronto’s relative strength in social boundaries. On average, compared to the global values, Toronto has higher opportunities for youth, a larger per capita economy, full energy access and higher public safety and security indicators.
References
[1] IUCN, 2014, Iucn Red List of Threatened Species, IUCN Global Species Programme Red List Unit, August 19, 2014, http://www.iucnredlist.org/about/summary-statistics#Tables_1_2
[2] Jason Travers, 2009, Species at Risk Stewardship Fund Projects in the Greater Toronto Area, Ministry of Natural Resources and Forestry, August 19, 2014, http://news.ontario.ca/mnr/en/2009/07/species-at-risk-stewardship-fund-projects-in-the-greater-toronto-area.html
[3] WWF, 2014, Living Planet Report 2014, World Wide Fund (WWF), Switzerland.