Shanghai
With a population of 18.4 million (2010 data), Shanghai is China’s largest metropolitan area [1]. Shanghai is susceptible to flooding; greenhouse gas emissions and air quality are relatively higher than global averages (Figure 1 and Table 1); the levels of CO2-equivalent emissions and particulate matter (PM2.5) are reported as 11.7 tCO2e/cap/year and 81μg/m3, respectively; and the average domestic fresh water use in Shanghai Metropolitan Area is 411 L/cap/day, which is four times the global ‘Water Right-level’ proposed by the United Nations.
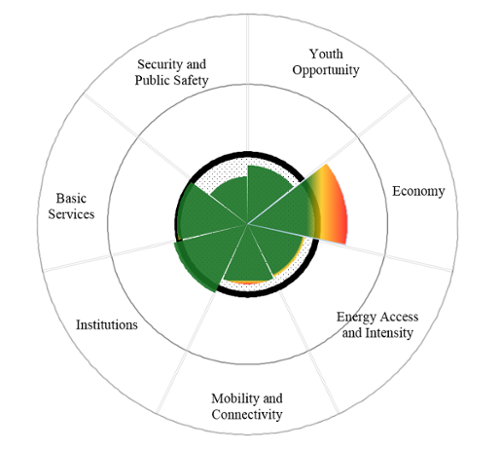
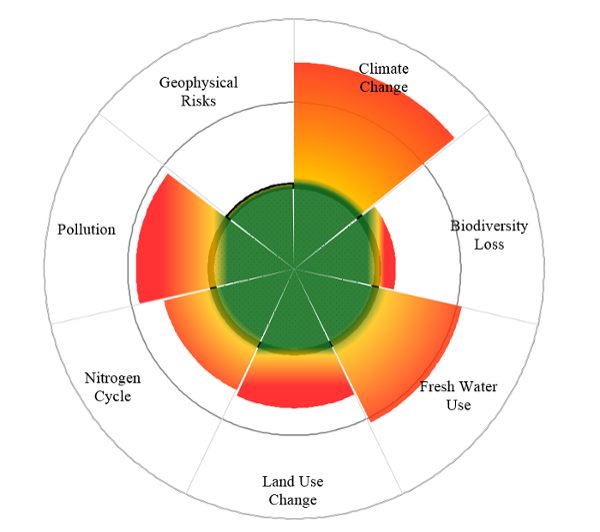
Figure 1: Physical Science: Shanghai vs. Global Condition
Shanghai is well-served by its public transportation system and, as shown in Figure 2 and Table 2, provide relatively high level socio-economic boundaries. Compared to Toronto, Shanghai’s higher Gini coefficient and lower per capita income are key economy indicators.
Figure 2: Socio-economic: Shanghai vs. Global Condition
References
[1] Christopher A. Kennedy, Nadine Ibrahim, Iain Stewart, Angelo Fachini, and Renata Mele, 2014, "An Urban Metabolism Survey Design for Megacities," Enel Foundation, Energy For Knowledge, Report # 2/2014.
Please note this is a draft version. For development purposes only.